Step by step, digital agencies are making the world around us a little cleverer. This ‘smartification’ goes beyond bits and bites… It involves facilitating people and their needs. So how does this work? ‘The Smartifiers’ is a series of case studies in which Dutch Digital Agencies members showcase what smartification looks like in practice.
In this edition you can read how digital data design and technology agency CLEVER°FRANKE, commissioned by the Chicago Metropolitan Agency for Planning (CMAP), used data and design to help the city of Chicago generate support for a better infrastructure. Design Director Wouter van Dijk explains this unique project.
You only learn the importance of infrastructure when something is wrong. Congestion, traffic jams or bad road surfaces are examples of how a poorly functioning infrastructure can have a negative impact. At the same time, infrastructure is not the sexiest of subjects and road repairs and rail maintenance rarely have the same urgency as, say, the financing of schools or the police. This apathy had led to a number of pressing issues in Chicago in 2014 as outdated transit systems, roads, gas pipelines and other vital structures fell into decline and the costs to repair them continued to rise.
Insight into infrastructure
To turn things around and generate more support for infrastructural improvements, the Chicago Metropolitan Agency for Planning (CMAP) contacted the Dutch data design and technology agency CLEVER°FRANKE in 2015. The agency develops data-driven products and insightful, visual analyses of data for companies and organisations such as Google, Cisco and the Eurovision Song Contest. The challenge was clear: to create an interesting story based on data that teaches residents to think differently about infrastructure and its consequences on the region, the city and the people who live and work there.
“CMAP had a wealth of unstructured data on the condition of bridges, traffic flows in the city and so on,” says Wouter van Dijk. “All very interesting perhaps but unstructured data does not help convince people – that requires the stories behind the data and diagrams.” To find those stories, CLEVER°FRANKE worked closely with the planners to carefully comb through all the available data. Van Dijk: ‘We wanted to know what was there. Which data points are interesting enough to convince the public? What does the general public want to know? By comparing data over time, for example, we showed that public transport in the poor neighbourhoods of Chicago had been declining over a certain period. This is a fact that can be turned into a story. Exploring the data in this way, we found more and more stories that deserved to be told.”
“Visualising data in such a way facilitated a change in behaviour.”
The stories
Together with the analysts from CMAP, CLEVER°FRANKE then studied how these stories could be communicated via advertisements, banners, short videos and the like. “Ultimately we determined that a microsite was the most efficient and effective way to reach the general public, and provide a knowledge platform for the media at the same time.”
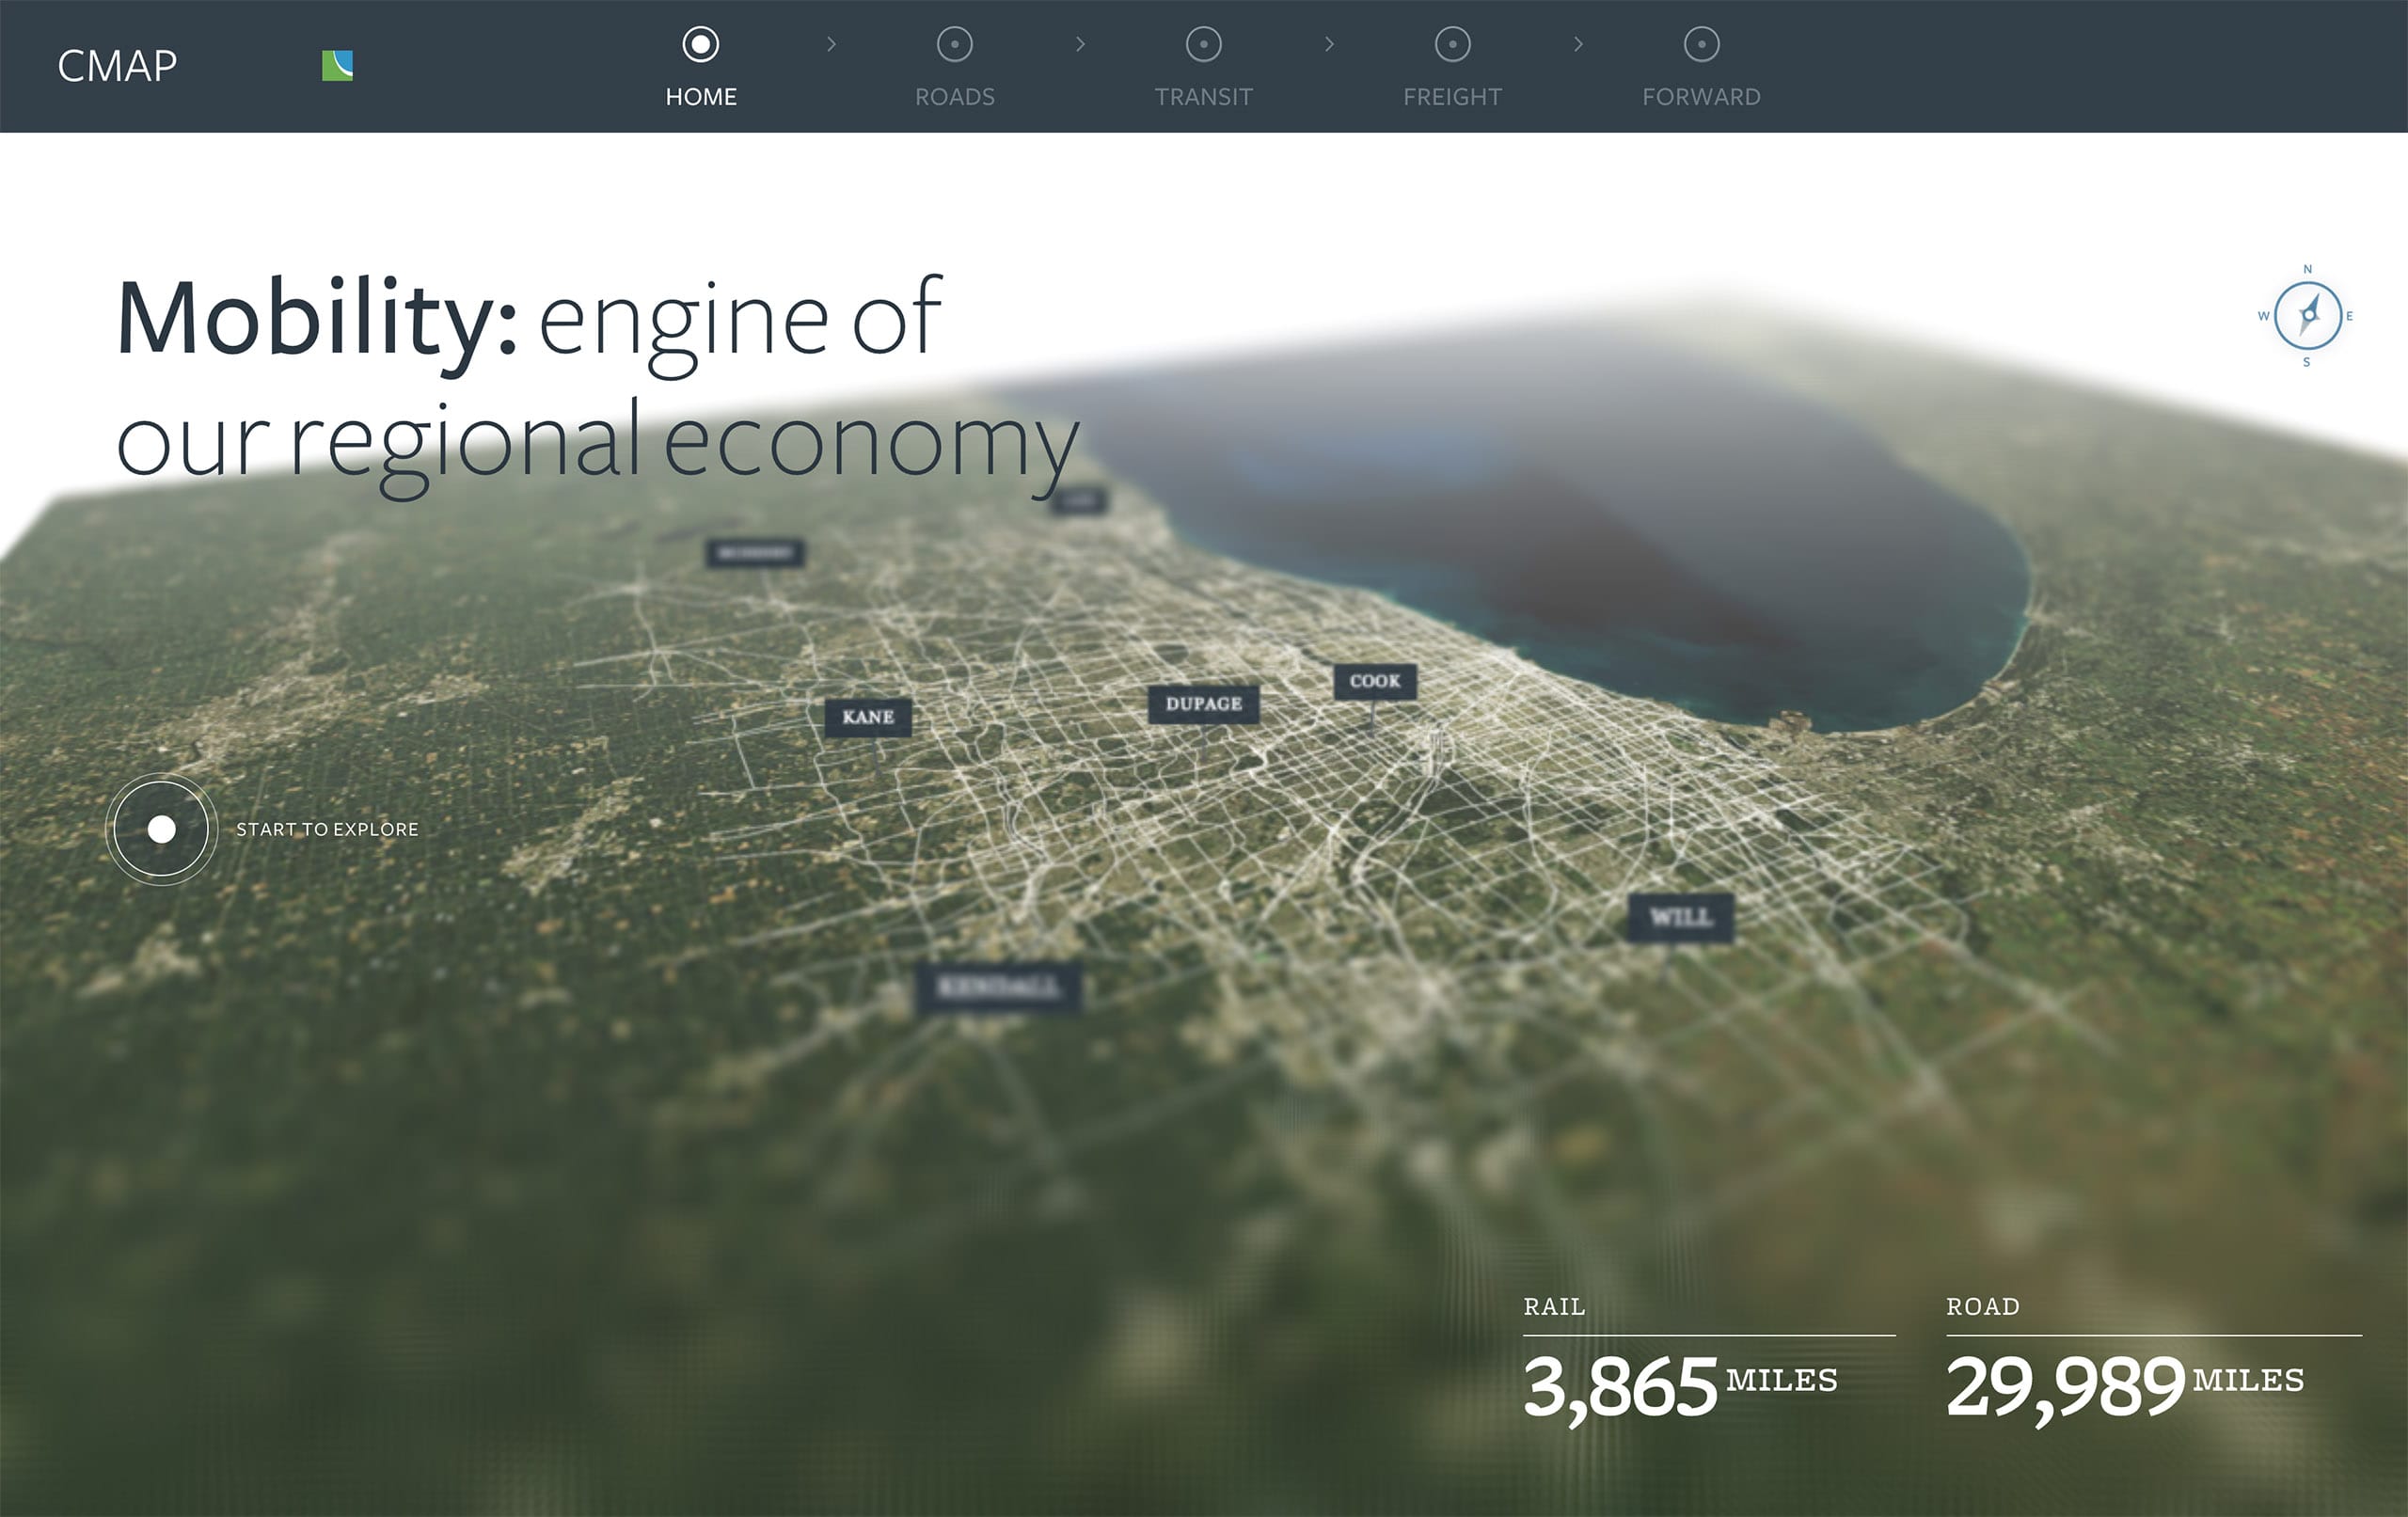
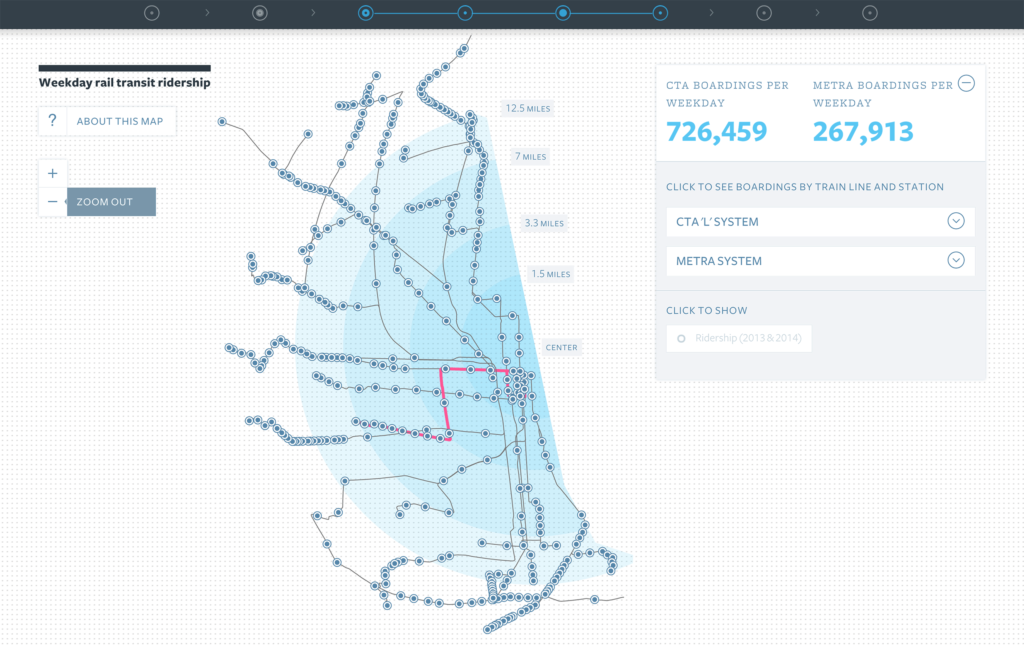
Solution
This resulted in the site www.cmap.illinois.gov/mobility/explore which shows the current status in the field of mobility and the infrastructure of the Chicago metropolitan region based on interactive data visualisations, videos, photos and the results of various studies into the infrastructure. Visitors can click on subjects for more details, including the condition of specific bridges, the delays at railway crossings and province-wide assessments of road quality. “Using the zoom in/zoom out concept, we provided the target group with both a macro and micro perspective,” explains Van Dijk. “Not just the main trends and challenges for the region, but the specific impact of these developments on residents and their daily lives.”
The result
Five years later, the website is still in use and a much broader insight into the infrastructural challenges faced by Chicago residents and policy-makers is available. Van Dijk sees this as the ideal result. “Visualising data in such a way facilitated a change in behaviour.” He also sees this is as something other government bodies (in the Netherlands and elsewhere) could benefit from too. “If you see design as a problem solver, good design is necessary to organise data, provide insights and tell a story that engages people. This approach works far better than a study and press release alone.”
Like to know more?
Check out other projects by CLEVER°FRANKE or contact Wouter van Dijk
Read the other Smartifiers cases
“The Smartifiers” (or De Verslimmers) is a series about the way in which Dutch digital agencies keep making the world around us a little smarter. All articles in the series have also appeared on Emerce.
The Smartifiers cases (English)
The Smartifiers part 1: Stories inspire Chicago residents to think about infrastructure (CLEVER°FRANKE)
The Smartifiers part 7: How Mibo revitalised the after-work Friday drinks online (Q42)
The Smartifiers part 9: Happi app gives patients greater control over their illness (E-sites)
The Smartifiers part 10: All the world’s Van Goghs online
Verslimmers cases (Dutch)
De Verslimmers deel 1: Verhalen laten Chicago bewoners nadenken over infrastructuur (CLEVER°FRANKE)
De Verslimmers deel 2: Digitaal spelbord helpt jeugdhulpverleners bij besluitvorming (Greenberry)
De Verslimmers deel 3: Content op maat voor elke bezoeker (Snakeware)
De Verslimmers deel 4: Gamification helpt jonge gedetineerden te praten over morele dilemma’s (Kaliber)
De Verslimmers deel 5: App voorkomt lege binnenvaart (Swis)
De Verslimmers deel 6: Digitalisering van een 128 jaar oude drukkerij (Redkiwi)
De Verslimmers deel 7: Mibo videochatapp maakt van videobellen een interactieve ervaring (Q42)
De Verslimmers deel 8: Hoe NS de OV-fiets innoveerde (INFO)
De Verslimmers deel 9: Happi app geeft patiënten weer grip over hun ziekte (E-sites)
De Verslimmers deel 10: Van Gogh Worldwide: Data van ruim 1000 kunstwerken op één platform